
Rabu, 16 Julai 2025


.png)


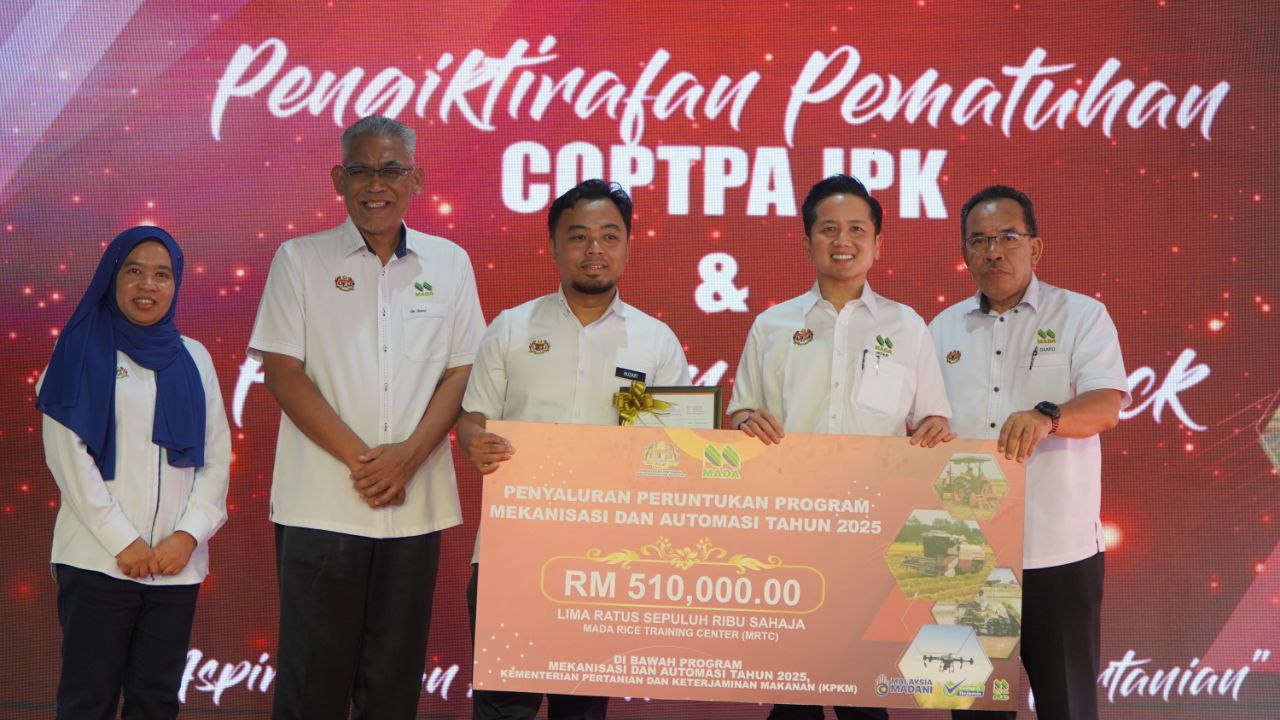
Jun
Sebagai pembuka tirai kepada sambutan bersejarah ini, satu Majlis Bacaan Surah Yasin dan Doa Selamat...
Jun
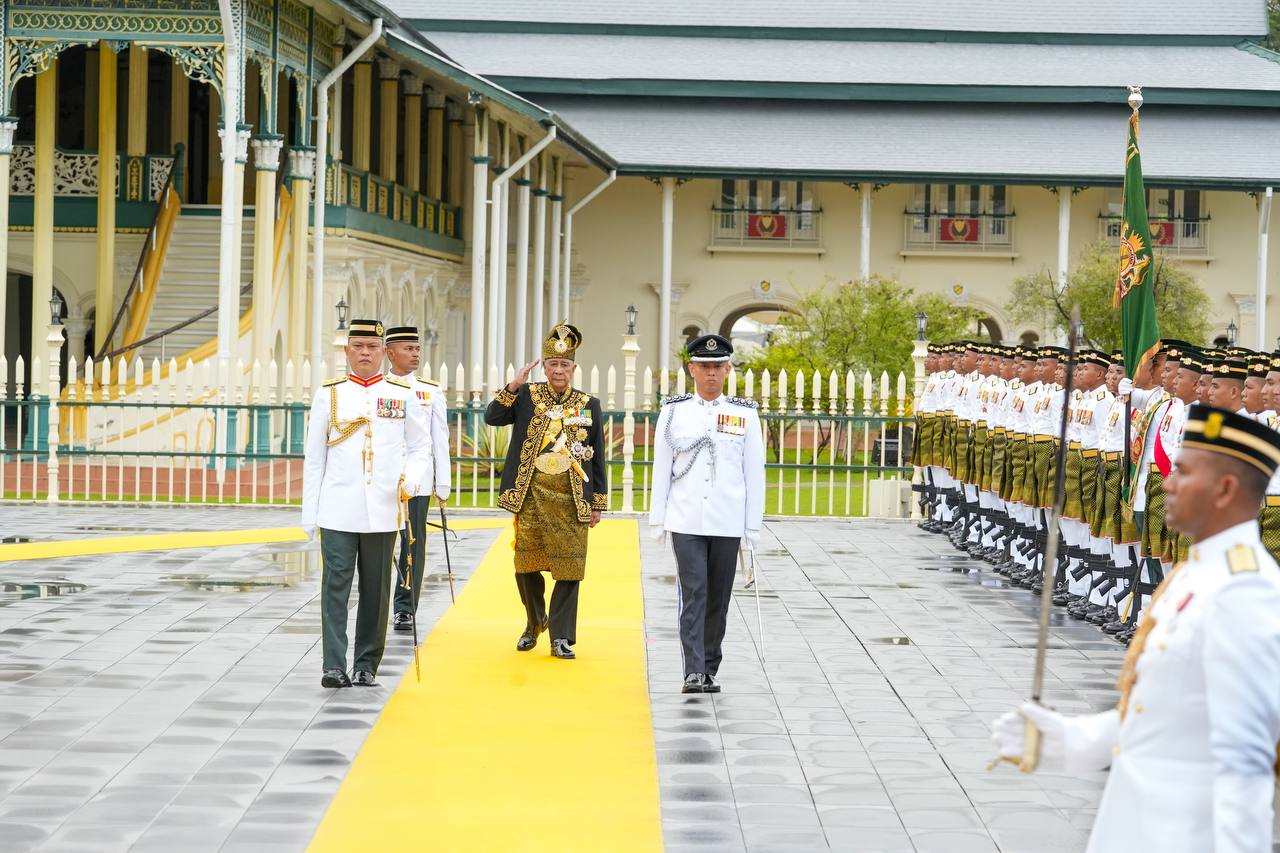
Sultan Negeri Kedah, Kebawah Duli Yang Maha Mulia Al Aminul Karim Sultan Sallehuddin Ibni Almarhum S...
Jun
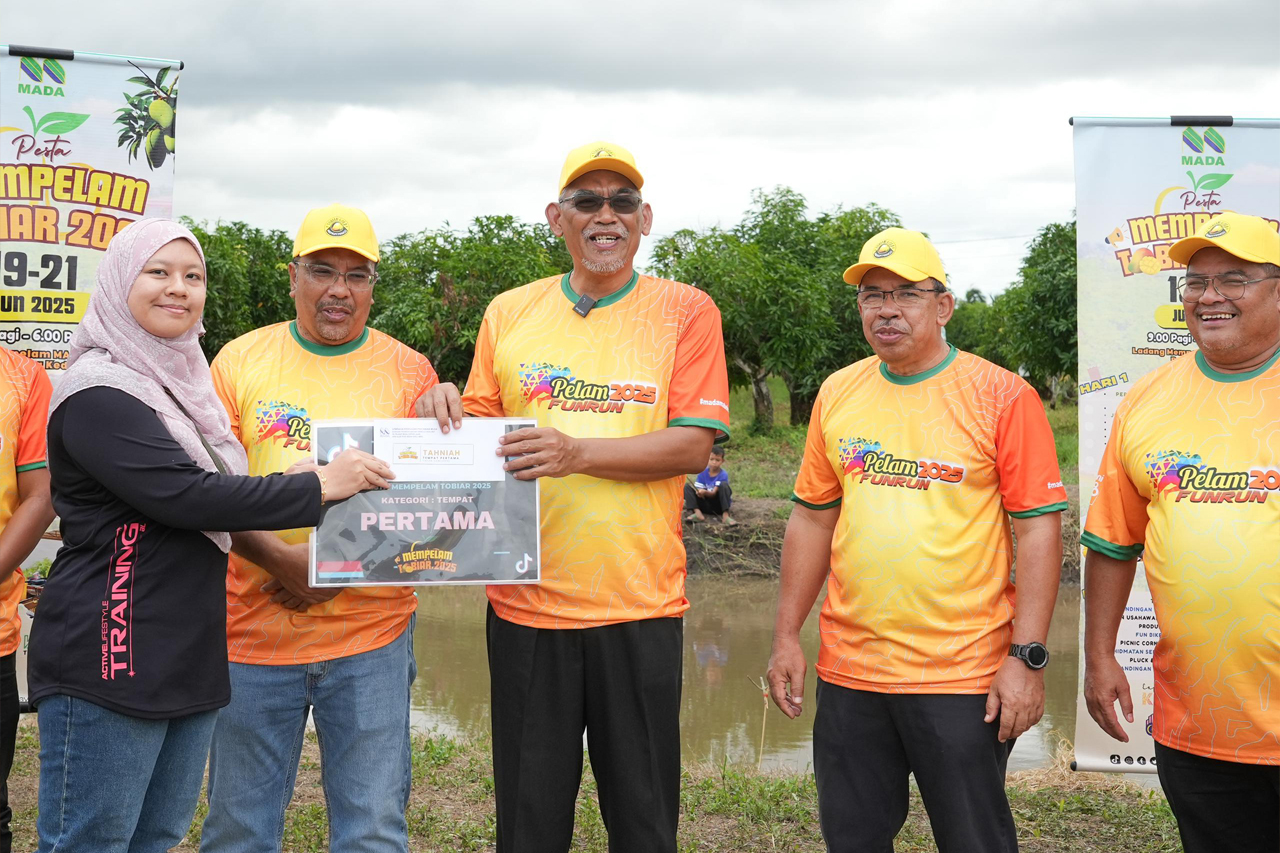
Pesta Mempelam Tobiar 2025 yang diadakan selama tiga (3) hari oleh Lembaga Kemajuan Pertanian Muda (...
Jun
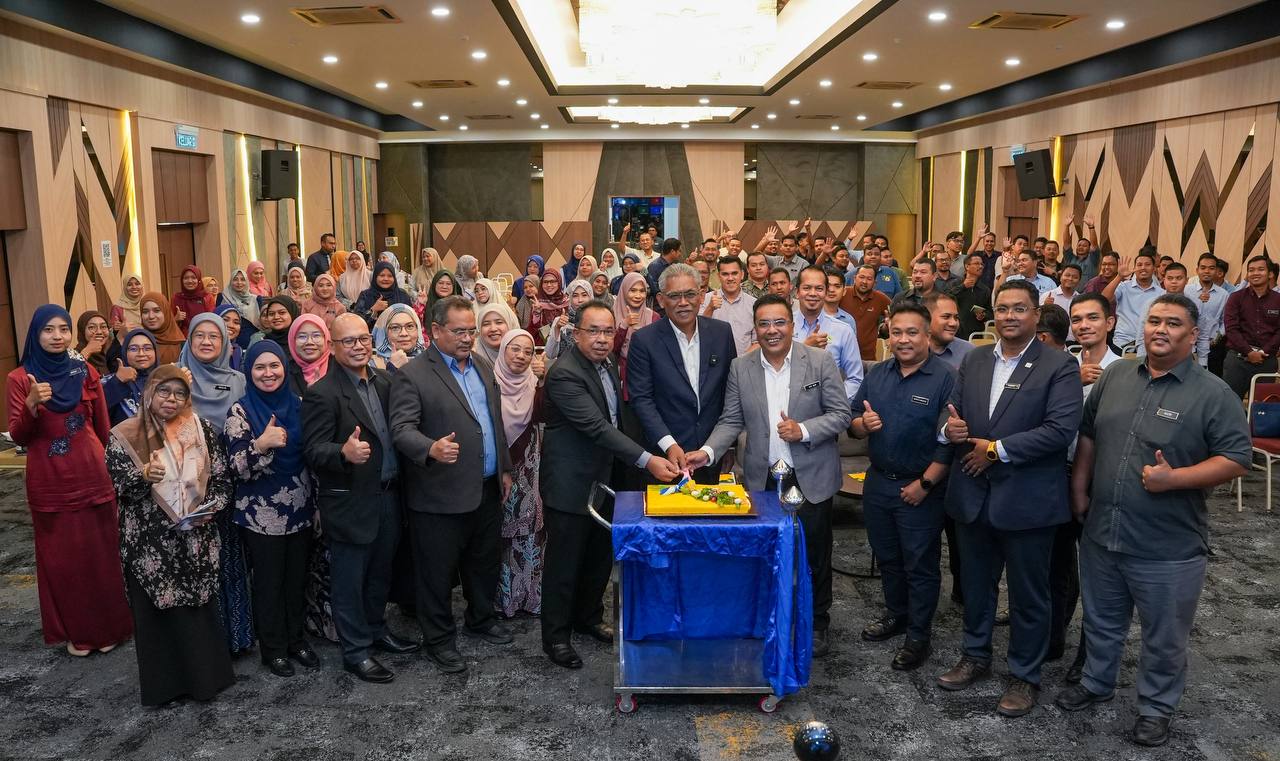
Perhimpunan Bulanan MADA Tahun 2025 yang diadakan ini telah menjadi satu medium penting utama dalam ...
 01.jpg)
Jun
Lembaga Kemajuan Pertanian Muda (MADA) ingin merakamkan ucapan penghargaan dan terima kasih ke atas ...
 01.jpg)
Jun
Hari ini telah menyaksikan satu pertemuan baharu di antara Timbalan Ketua Setiausaha (Dasar) Kemente...
.jpg)
Jun
Pihak Lembaga Kemajuan Pertanian Muda - MADA amat berbesar hati menerima kunjungan hormat daripada Y...
.jpg)
May
Koperasi Pegawai-Pegawai Lembaga Kemajuan Pertanian Muda Berhad (KOMADA) hari ini telah mengadakan M...
.jpg)
May
Pada hari ini Yang Berusaha Encik Zulkifli bin Romli, Pengurus Besar MADA telah mengadakan kunjungan...
May
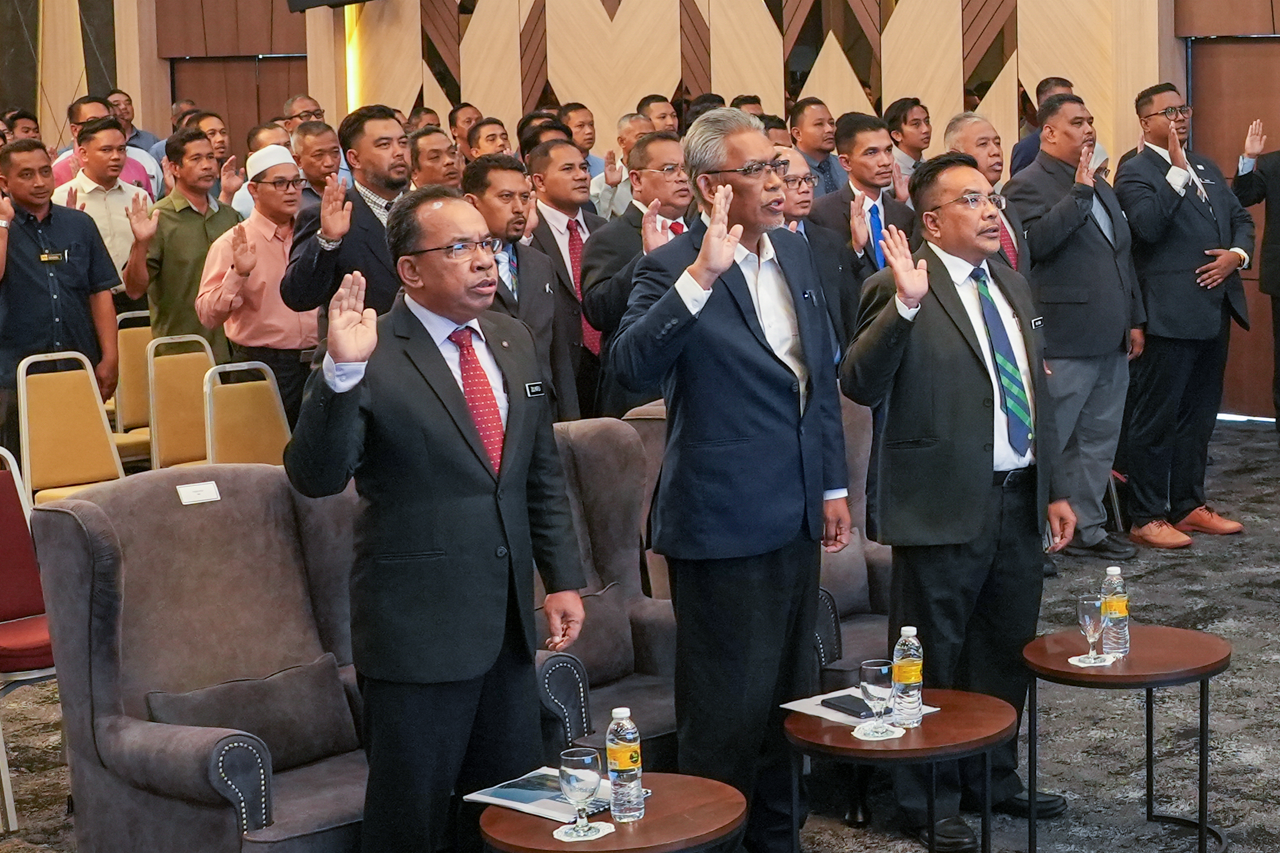
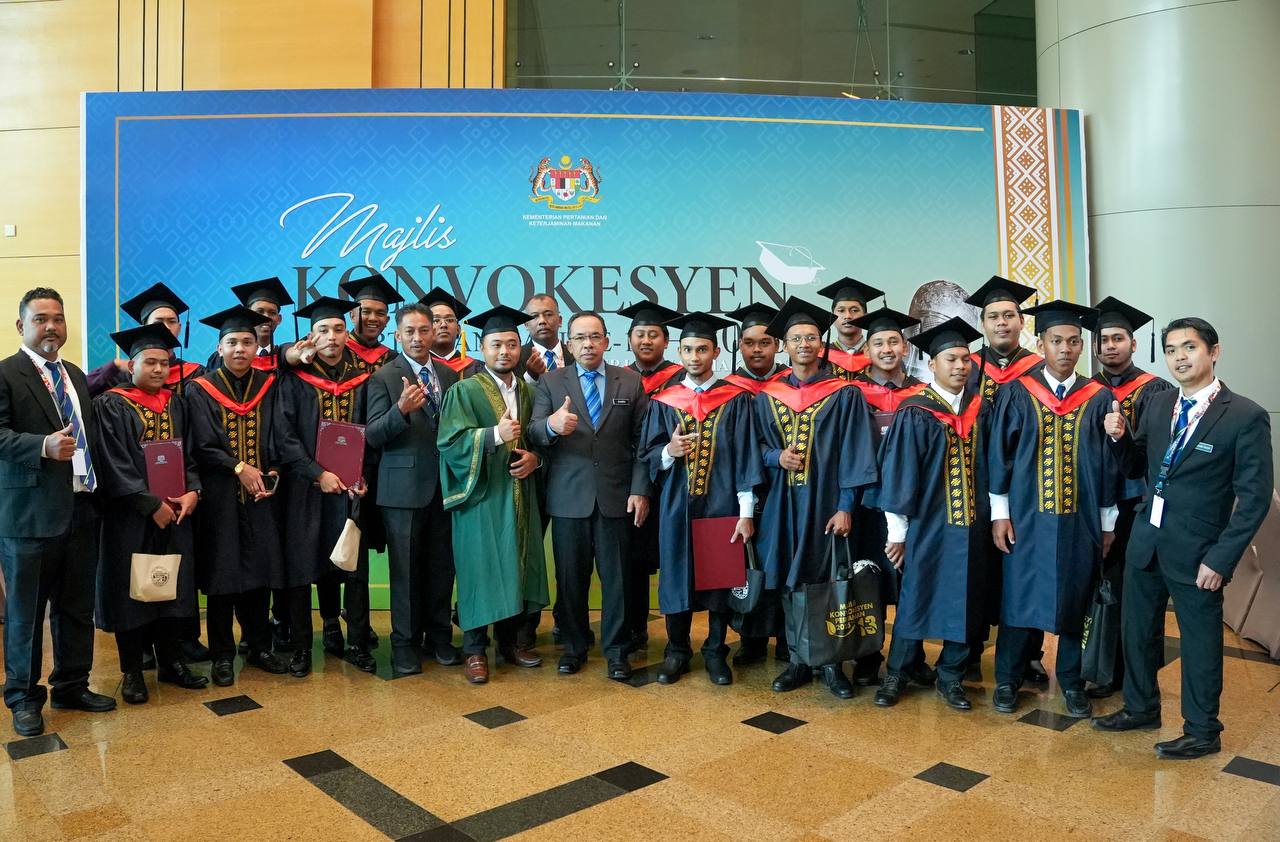
Seramai 784 orang graduan yang terdiri dari Diploma dan Sijil Kemahiran Malaysia, Sijil Pertanian, S...
May
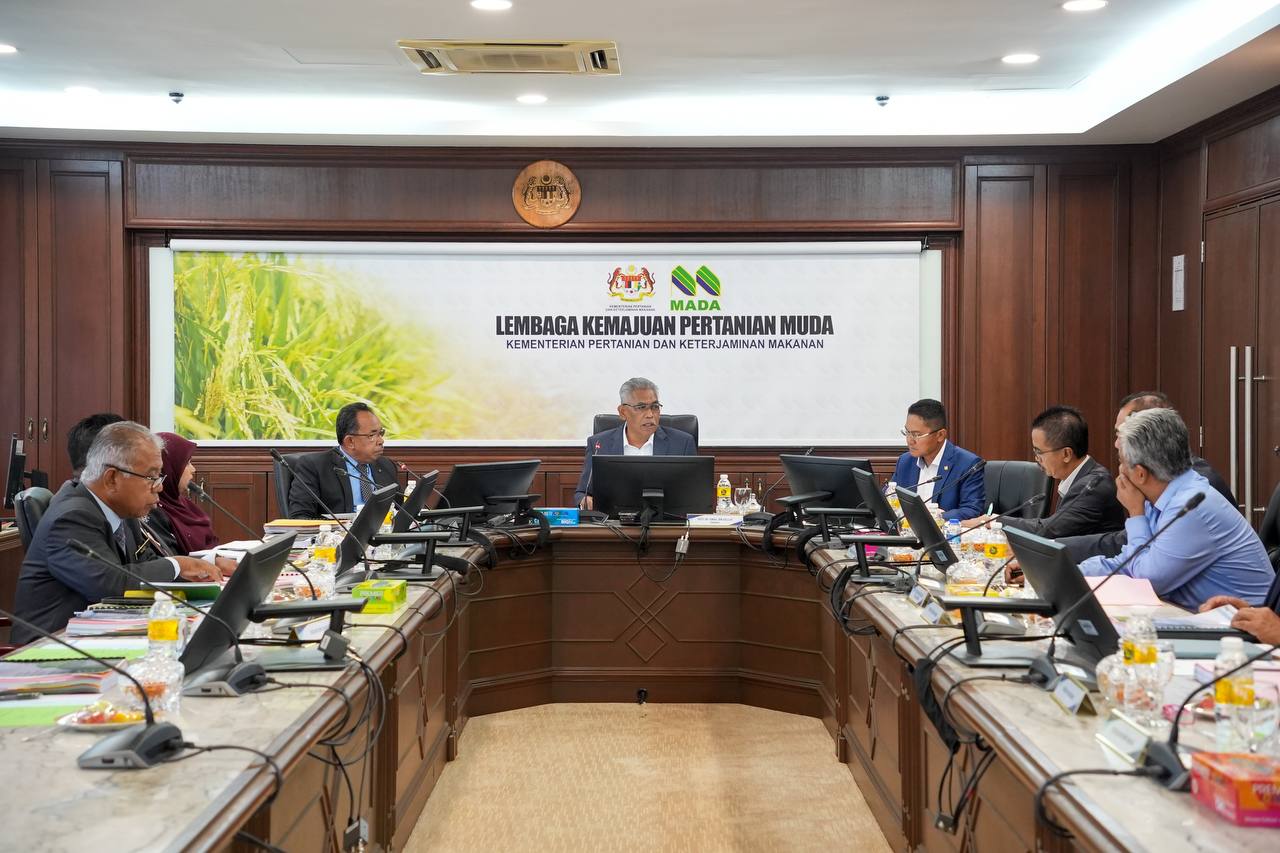
Pada hari ini telah berlangsung Mesyuarat Lembaga Pengarah MADA Bilangan 2/2025 bertempat di Bilik M...
May
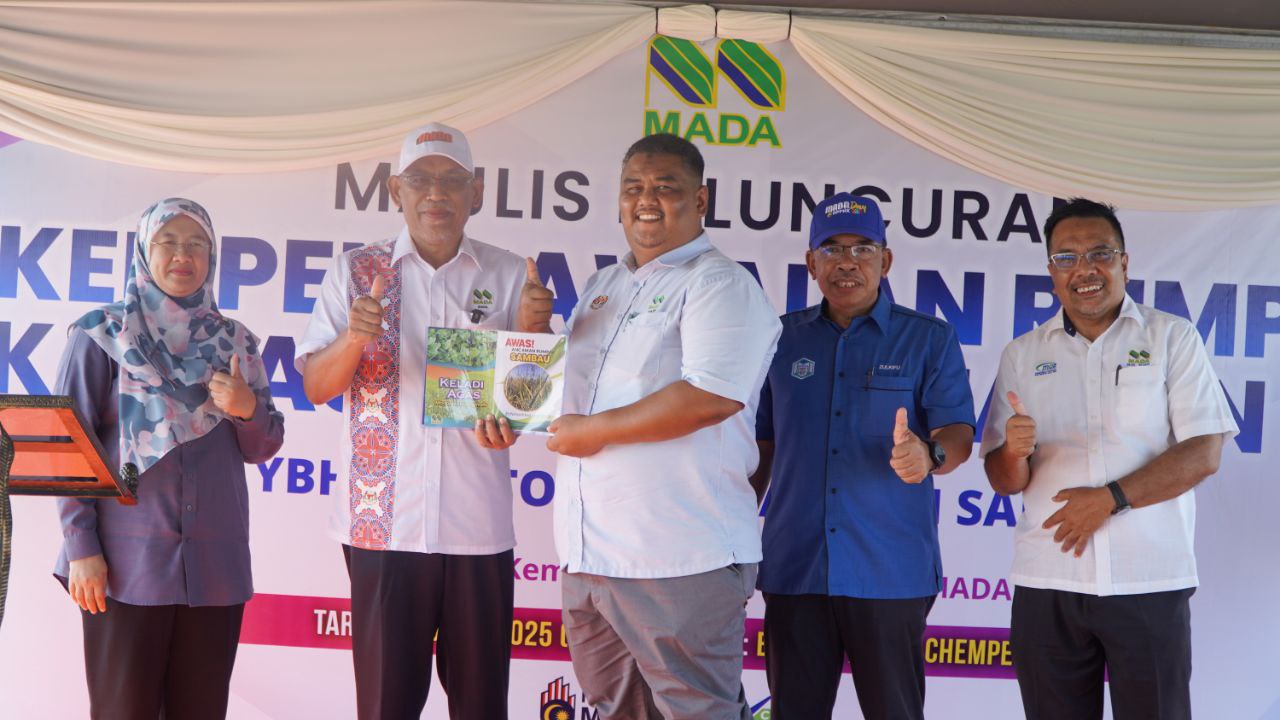
Agenda peningkatan produktiviti tanaman padi di Kawasan Muda adalah merupakan agenda utama pihak Ker...
.jpg)
May
Penganjuran program “Jom Turun Bendang 2025” yang dianjurkan ini adalah merupakan salah satu med...

May
Seramai 106 orang kakitangan MADA telah dipilih sebagai penerima anugerah yang terdiri dari 10 orang...
May
Pada hari ini, Bahagian Pembangunan Kapasiti dan Latihan Pertanian (KPKM) bersama-sama Lembaga Kemaj...
.jpg)
May
DYMM Raja Perlis Tuanku Syed Sirajuddin Ibni Almarhum Tuanku Syed Putra Jamalullail bersama DYMM Raj...
.jpg)
May
Festival Mango & Agricultural Industry (PERMAI) 2025 dengan gabungan Hari Peladang, Penternak dan Ne...